Article summary
We see big shifts in the elections. But when you look under the hood, you see more stability, not just polarization.
Read the full article: Under the Electoral Cover
reading time: 5 minutes
The major transformations are mainly cosmetic
Even if there are major shifts in election results, as we saw again on March 15, the fundamental electoral shifts are less than one might think. But then we should not look at each party separately, but at the electorate blocks in the electorate. They have preference for more than one party, but during elections they can only choose one of them.
This article gives an impression of those blocks and their preferences. It provides more insight into electoral relations and within what margins shifts in the electorate can occur.
With a recent survey among more than 5,000 respondents via Peil.nl, we mapped this out to the largest political blocs.
This is done by indicating to a number of (potential) parties how likely people would vote for them if there were a parliamentary election now. The following charts show the numbers of those who said they would definitely vote or give that party/group a high or fairly high chance of getting a vote. It is filed for a set of properties.
We haven’t done this with all possible parties or all possible combinations, but for the sake of clarity we have seven (GroenLinks + PvdA, D66, CDA, Lijst Omtzigt, VVD, BBB, and PVV). Because of the way the question is asked, it is entirely possible that the respondent will give many parties/groups a (somewhat) high chance. Plus there are also voters who don’t give any of these groups a chance. (less than 25%) and voters who never convert (estimated at around 10%).
So there is no question of being able to collect voting probability figures for different parties/groups. The graphs show, for example, that many people give BBB and Lijst Omtzigt a (somewhat) high chance of getting a vote. How this works in an election depends very much on the situation at that moment and the lead-up to that election.
By comparing the results with a large number of characteristics, an insight into the position of the different political parties/groups in relation to the electorate can be given. And within what margins can shifts in the electorate occur.
Total numbers
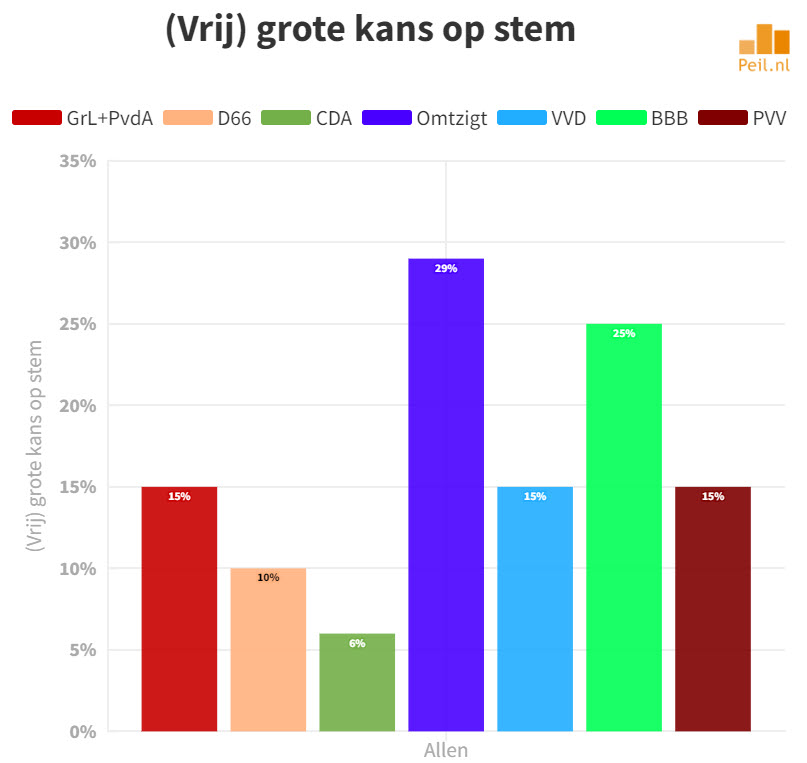
These are the total numbers of the seven parties/groups measured. Omtzigt’s list is cited by 29% of voters as a party that gives them a (fairly) high chance of getting a vote. BBB scores 25%. VVD and GroenLinks + PvdA and PVV scores are 15%, D66 is 10%, and CDA is only 6%.
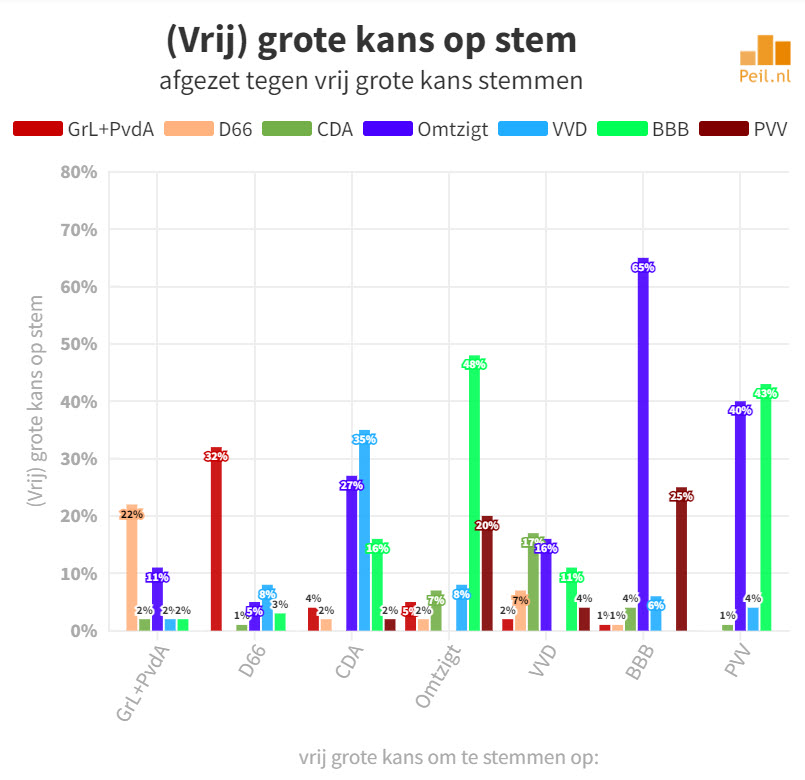
The following chart shows the relationship between choices for these seven parties/groups of parties.
With numbers above 10%, there is fierce competition between these parties.
- There is significant overlap between BBB and Lijst Omzigt. Among those who give the BBB a (somewhat) high chance, 65% also give a (somewhat) high chance to Lijst Omzigt and the opposite is 48%.
- PVV also has great competition with BBB and Lijst Omzigt. But PVV seems to be affected by the other two more than the other way around.
- Between GroenLinks + PvdA and D66 we also see fairly high values with D66 now at a disadvantage compared to GroenLinks + PvdA.
- Obviously, the situation of CDA and VVD is electrically difficult. Strong competition from BBB and Lijst Omzigt, but much less in the opposite direction. VVD appears to be moving in the direction of PvdA and CDA.
demographics
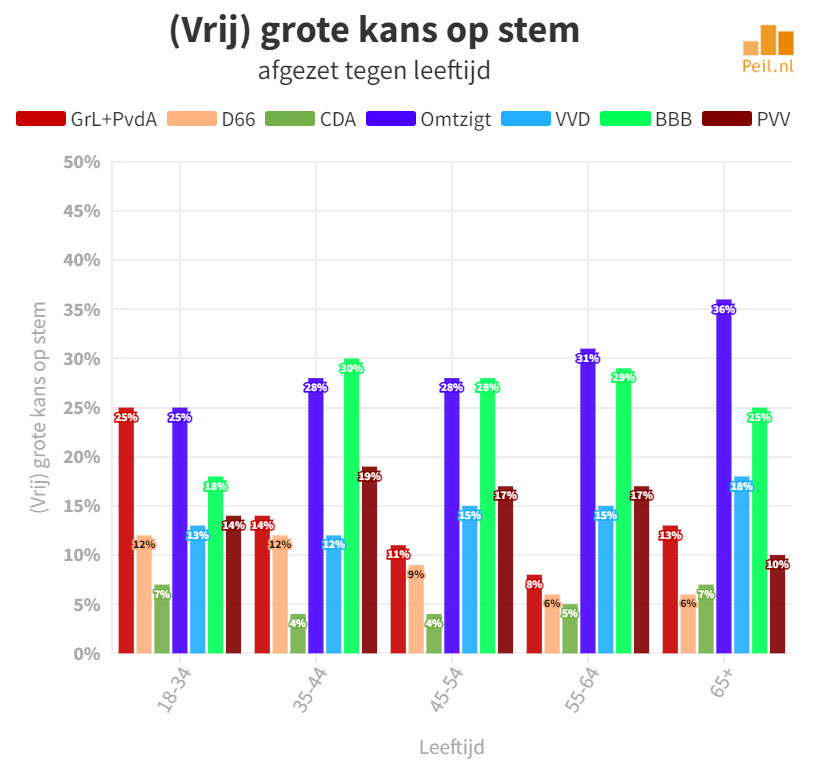
We see significant differences in preferences with respect to a number of demographic characteristics.
age
- GroenLinks + PvdA clearly scores better in the under 35 age group than in the other age groups (25% vs. 8% in the 55-64 group).
- Omtzigt’s list works better among the elderly than among the young (but is still as large as GroenLinks + PvdA among the under-35 group).
- The BBB performs better among the 35-65 age groups than among the young and the elderly.
- CDA actually performs poorly across the board. Also among the elderly, as they did well 15 years ago.
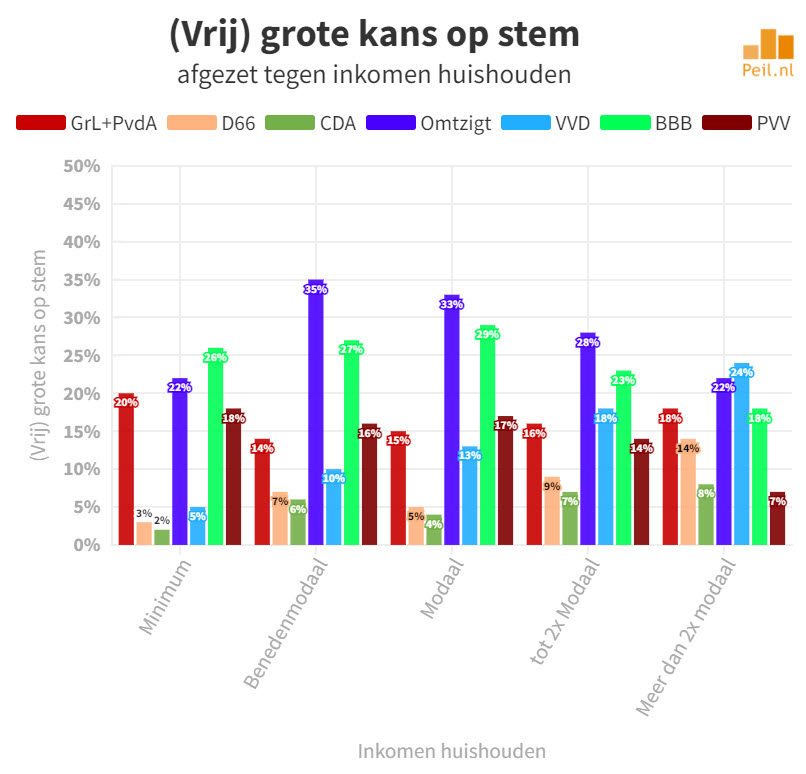
Enter
- It is clear that both VVD and D66 do better with high incomes than with low incomes.
- The average income in Lijst Omzigt is somewhat lower than in the BBB.
- PVV center of gravity is among the lowest income
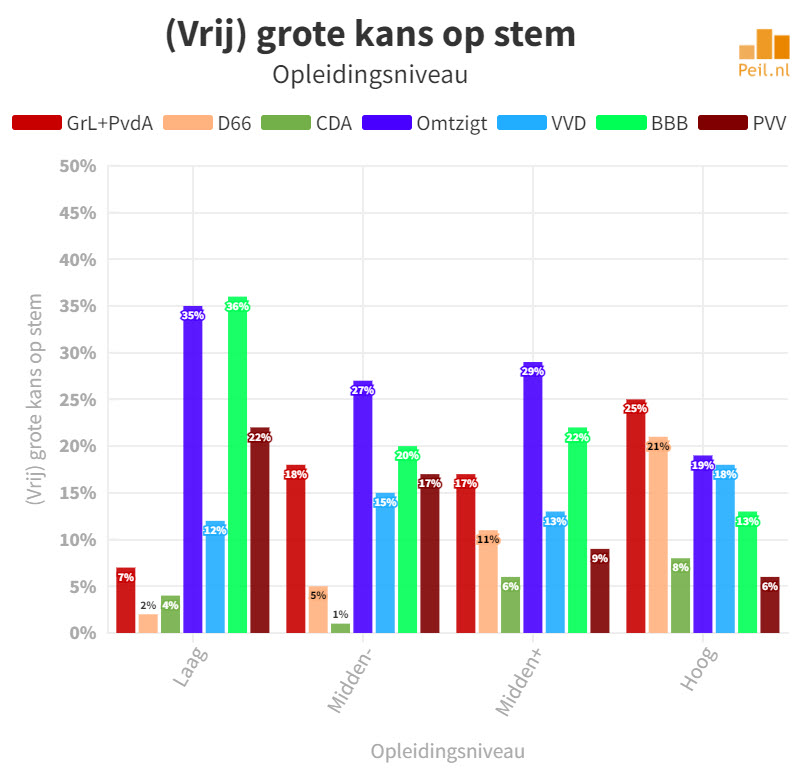
Educational attainment
The differences in education are significant:
- BBB, Lijst Omtzigt, and PVV perform better among those with a low level of education than among those with a high level of education.
- With D66 and GroenLinks + PvdA it’s the other way around.
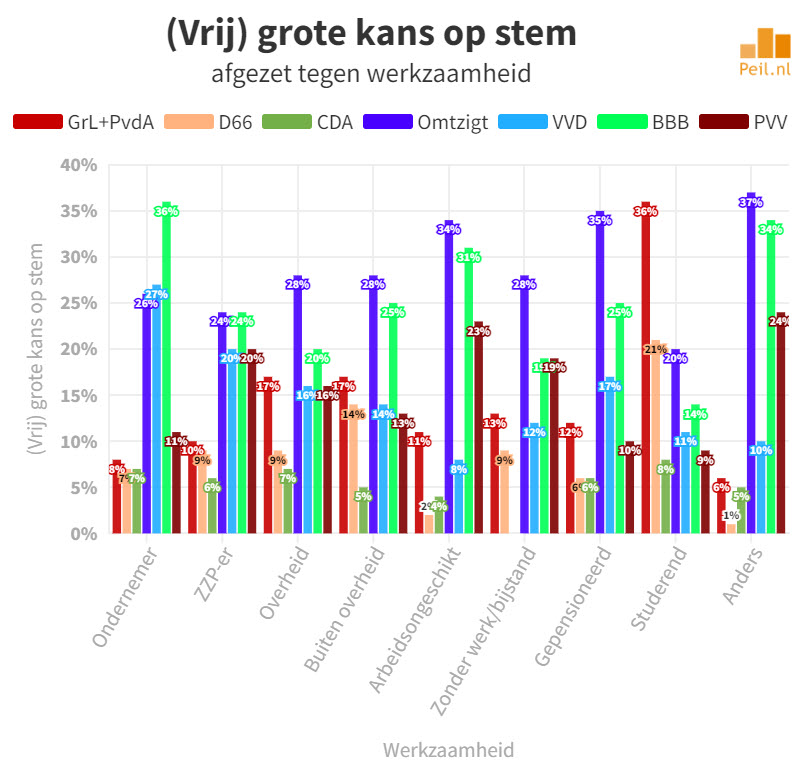
effectiveness
This graph shows the differences by type of respondent’s activity.
- BBB, VVD and Lijst-Omtzigt are entrepreneurial parties
- Among the self-employed, PVV is also added.
- There is a big difference between the choices of retirees and students. The first group picks Omzigt and BBB list the most. Group II GroenLinks + PvdA and D66.
political traits
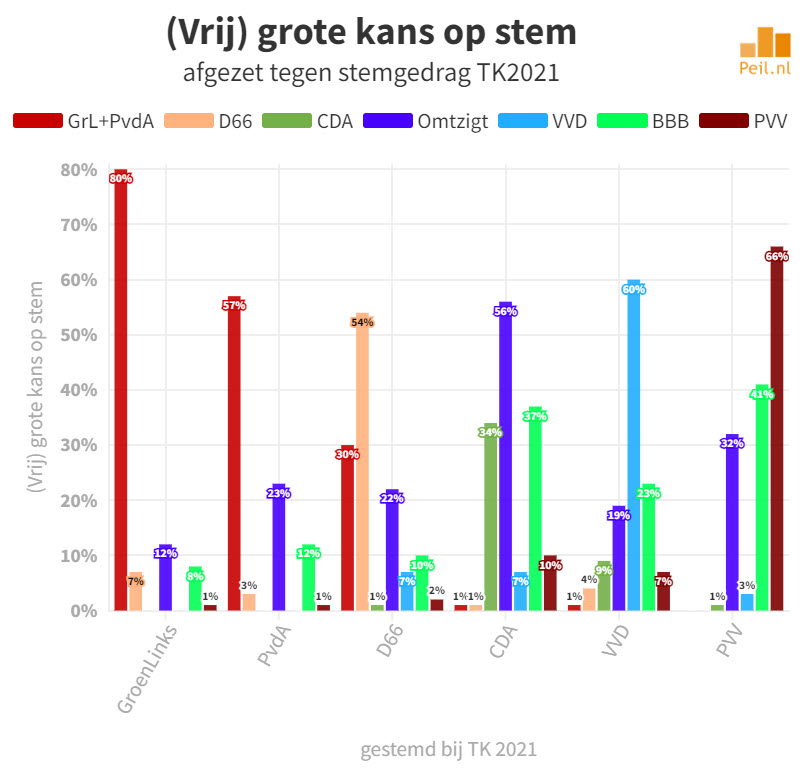
He voted in TK2021
This graph shows voter numbers for the 2021 parliamentary election. It clearly shows how far CDA and D66 have fallen among their voters as of 2021. It can also be seen that the GroenLinks + PvdA combination works better among GroenLinks voters from 2021 than PvdA did at the time.
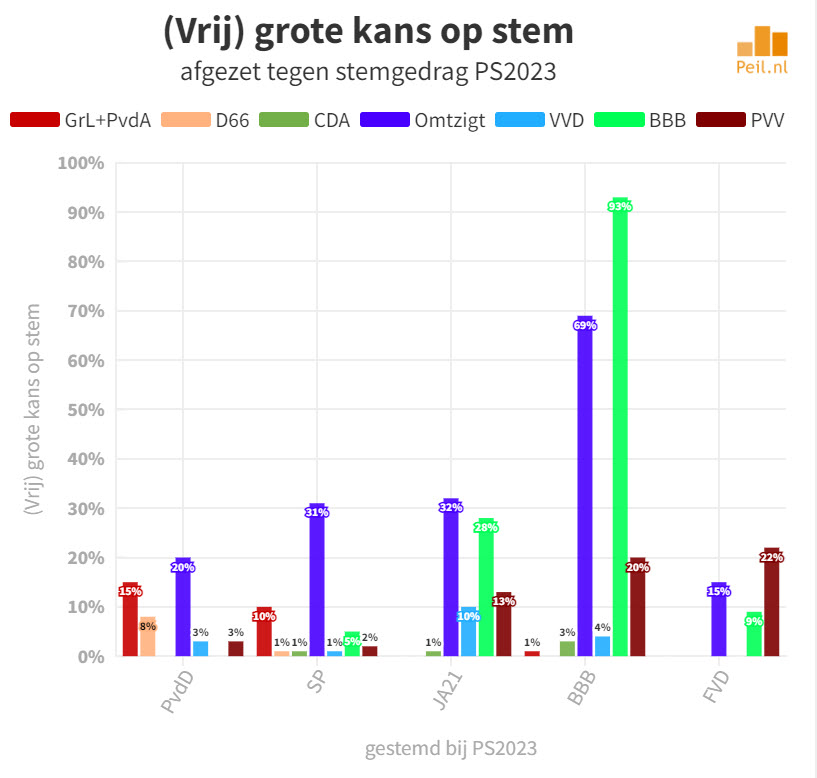
You voted at PS2023
In this overview, we see different sides of the TK2021 overview. This is partly because there are more respondents from those parties than in 2021.
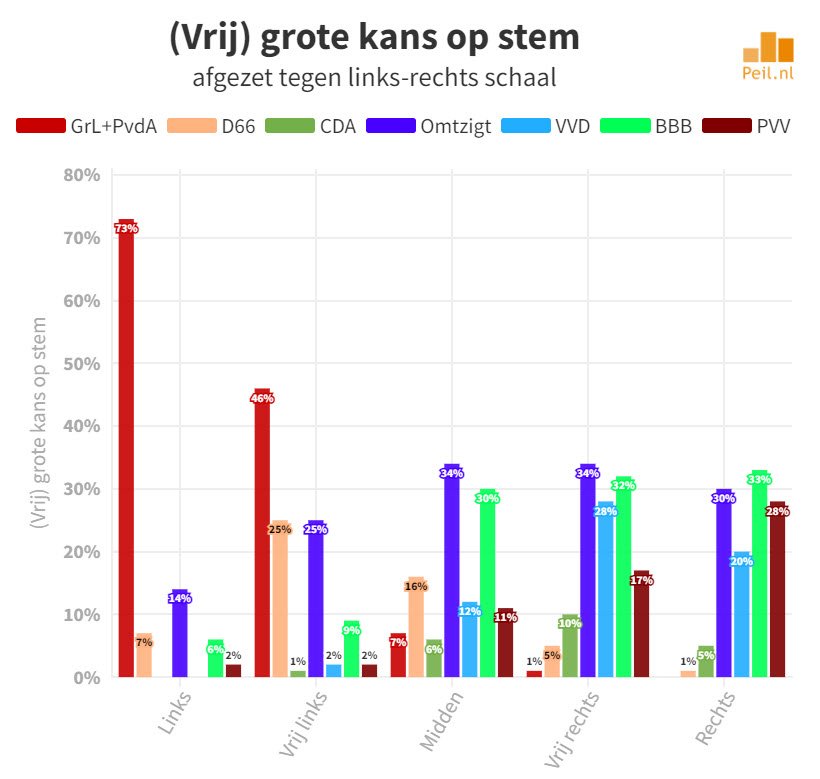
Left and right scale
The left-right scale still showed significant differences in the results. It can be seen that Omtzigt’s list is most spread out on the left and right.
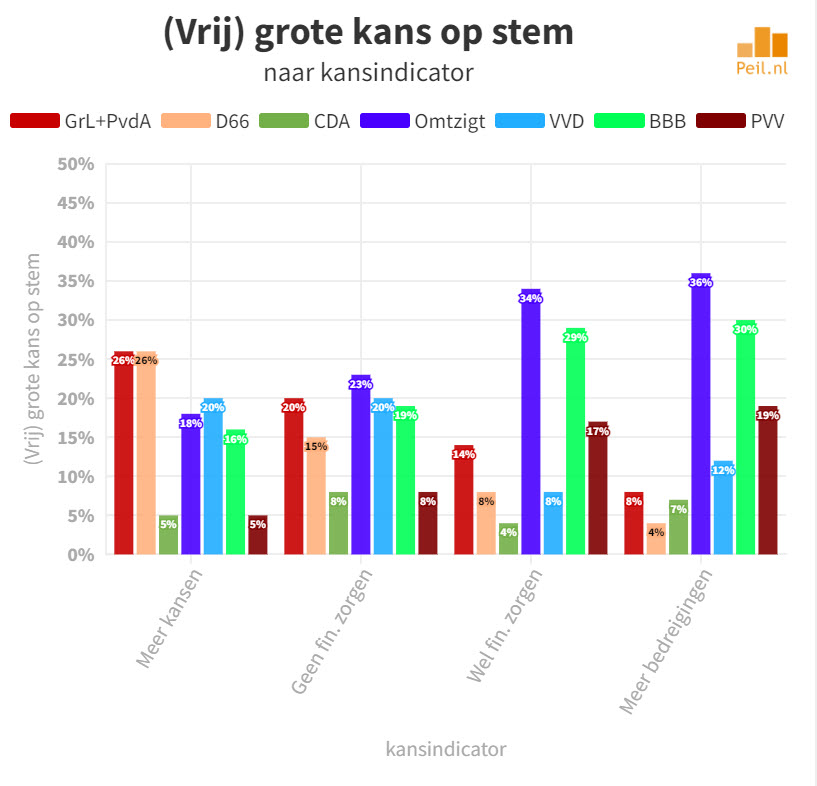
opportunity indicator
The two Opportunity Indicators questions also show clear differences whether “people are concerned about the financial future or not” and whether “people think they have seen more opportunities or threats in recent years”.
modes
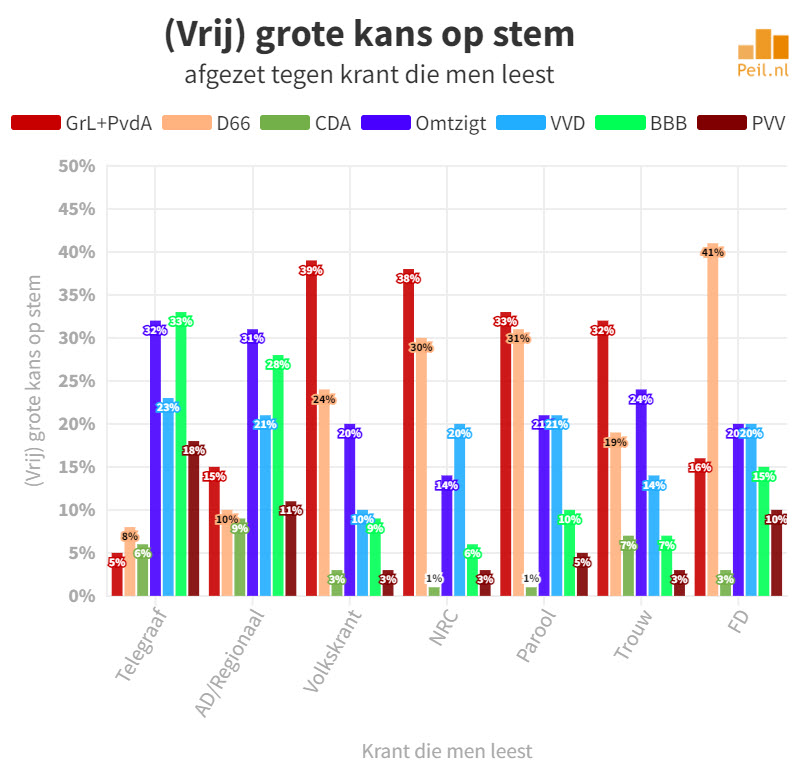
Finally, we have an overview of the newspaper that people read regularly. There is clearly a big difference between these seven arguments:
- Telegraph: BBB, List Omtzigt, VVD and PVV
- AD/Regional: Omtzigt List, BBB, and VVD
- De Volkskrant: GroenLinks+PvdA, D66 and Lijst Omtzigt
- NRC: GroenLinks+PvdA, D66, VVD, List Omtzigt
- Parool: GroenLinks + PvdA, D66, Lijst Omtzigt, VVD
- Trouen: GroenLinks + PvdA, Lijst Omtzigt, D66 (the low score for CDA is amazing)
- FD: D66, Omtzigt List and VVD
Remarkably, among these media, D66, which scores 10% across the Netherlands, among 7 media scores much higher than that value. At GroenLinks+PvdA, we also see high scores in four of the seven media. On the other hand, we see that the BBB scores are well below the national numbers for five of the seven titles. Omtzigt’s list is ubiquitous in the first three.
Not just polarizing
Although GroenLinks + PvdA + D66 has certainly polarization on the one hand and PVV on the other in most characteristics, it is remarkable that Lijst Omtzigt and BBB have much less. They have strong supporters in most of the groups shown in this overview.
In addition, it is also evident that VVD appears to proceed in the same way as PvdA and CDA. The attractiveness of this party has greatly decreased and the question is what will remain if Rutte is no longer party leader.
This does not predict the actual outcome of the upcoming elections. Know that these 7 parties/groups have already scored 115% all together. and that other parties not included in the study also scored at least 35% together. This means that in an election it will mainly be about voters giving your party a (more or less) good chance of converting to a real vote and another potential party also getting a good chance of not voting.
What Peter Umtzigt does will be crucial in the upcoming elections. Whether or not he participates in the elections and in what way will have a significant impact on the outcome.

“Travel enthusiast. Alcohol lover. Friendly entrepreneur. Coffeeaholic. Award-winning writer.”

